Boost Your Google Maps Ranking Today
Local SEO, Google Maps Ranking, Google Business Profile
Why Your Competitors Rank Higher on Google Maps (And What to Do About It)
If you’ve ever searched your own business on Google Maps and wondered, “Why are they above us? We’re clearly better,” you’re not alone. In 2026, Google Maps doesn’t simply reward the best business; it rewards the business that shows the strongest local trust signals. For agencies and local businesses, understanding this difference is the key to winning more visibility, leads, and revenue from local search.
Google Maps Ranks Trust, Not Ego
Google has been very clear: local rankings are built on relevance, distance, and prominence. In practice, that means Google is constantly asking, “Which business looks most trustworthy and useful for this specific searcher, right now?” not “Who thinks they’re the best?”
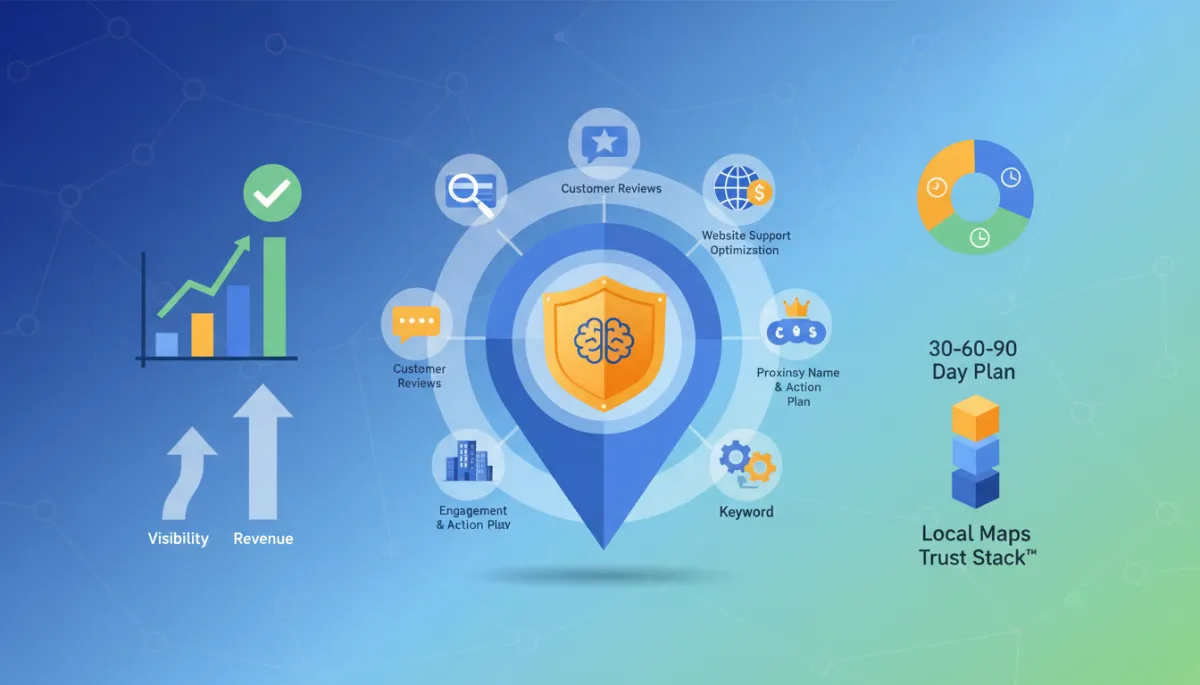
Competitors often outrank you because they’ve built a stronger Local Maps Trust Stack™—a layered set of signals that prove to Google they’re relevant, local, and widely trusted. Let’s break down those layers and where gaps usually appear.
1. Business Profile Optimization: Your New Home Page on Google
Your Google Business Profile (GBP) is often seen before your website. In recent studies, GBP signals account for roughly a third of local ranking influence. Competitors who outrank you usually:
Choose the most precise primary category and smart secondary categories.
Fill out every field: services, products, attributes, hours, special hours, booking links, and more.
Post regularly with offers, events, and updates, signaling active management.
A half-complete profile is a half-hearted trust signal. For agencies, GBP optimization should be treated like on-page SEO: structured, strategic, and ongoing.
2. Category Relevance: The “Fit” Factor You Can’t Ignore
The primary category you choose is one of the strongest individual ranking factors. If you’re a “Family Law Attorney” but your profile is set to “Law Firm,” you’re sending a weaker relevance signal than the competitor who picked the exact match category for “Divorce Lawyer” or “Family Law Attorney.”
Agencies should audit clients’ categories against top-ranking competitors for each core service. Category misalignment is one of the easiest, high-impact fixes in a Maps strategy.
3. Customer Reviews: Social Proof as a Ranking Engine
Reviews now influence both prominence and engagement. Google weighs not just your average rating, but also:
Quantity: Do you have enough reviews to be statistically trustworthy?
Recency & velocity: Are new reviews coming in consistently, not in one suspicious burst?
Responses: Do you reply thoughtfully to positive and negative feedback?
Competitors with a steady stream of fresh, keyword-rich reviews and active owner responses build stronger trust signals—and often, stronger conversion rates once they’re found.
4. Website Support: Your Site and Maps Are Joined at the Hip
Google increasingly connects your GBP with your website quality. Businesses that win on Maps typically have:
Dedicated, well-structured location or service pages that match their GBP categories.
Clean NAP consistency (Name, Address, Phone) across site and citations.
Local schema markup and mobile-optimized pages that satisfy users after they click through.
Strong alignment between your website and Business Profile amplifies every local trust signal.
5. Proximity: The One Factor You Can’t Control—But Can Work Around
Proximity still matters: a business closer to the searcher often has an advantage. But proximity is not destiny. When your Local Maps Trust Stack™ is significantly stronger, you can outrank closer competitors for many queries, especially higher-intent searches like “emergency plumber near me” or “best pediatric dentist in [city].”
6. Business Name Keywords: A Powerful but Risky Lever
Businesses that legitimately include keywords in their legal name—think “Smith & Co. Plumbing & Heating”—often enjoy a ranking boost. Google still reads those keywords as strong relevance signals. However, keyword stuffing fake names (“Best Cheap Emergency Plumber City”) violates guidelines and can lead to suspensions.
When doing competitor gap analysis, note who benefits from real keyword-rich names versus spammy ones. Report clear violations, but don’t build your strategy on shortcuts that can disappear overnight.
7. Local Citations and Local Authority: Your Wider Reputation
Citations—mentions of your NAP on directories and local sites—still matter, especially when they’re accurate and consistent. But in 2026, authority from local backlinks and editorial mentions carries even more weight. Google looks for:
Listings on key industry and local directories with matching details.
Links and mentions from local news, blogs, sponsorships, and “Best of [City]” lists.
Agencies should treat citation cleanup and local PR as core components of building Maps authority, not optional extras.
8. Engagement: The Hidden Signal Behind the Rankings
Google measures how users interact with your listing: clicks to call, direction requests, website visits, and repeat selections. Profiles that consistently attract and satisfy users send powerful behavioral signals back to Google’s algorithm.
That’s why high-quality photos, compelling posts, clear offers, and accurate information matter. They don’t just look good—they drive engagement that feeds your Local Maps Trust Stack™.
Building the Local Maps Trust Stack™
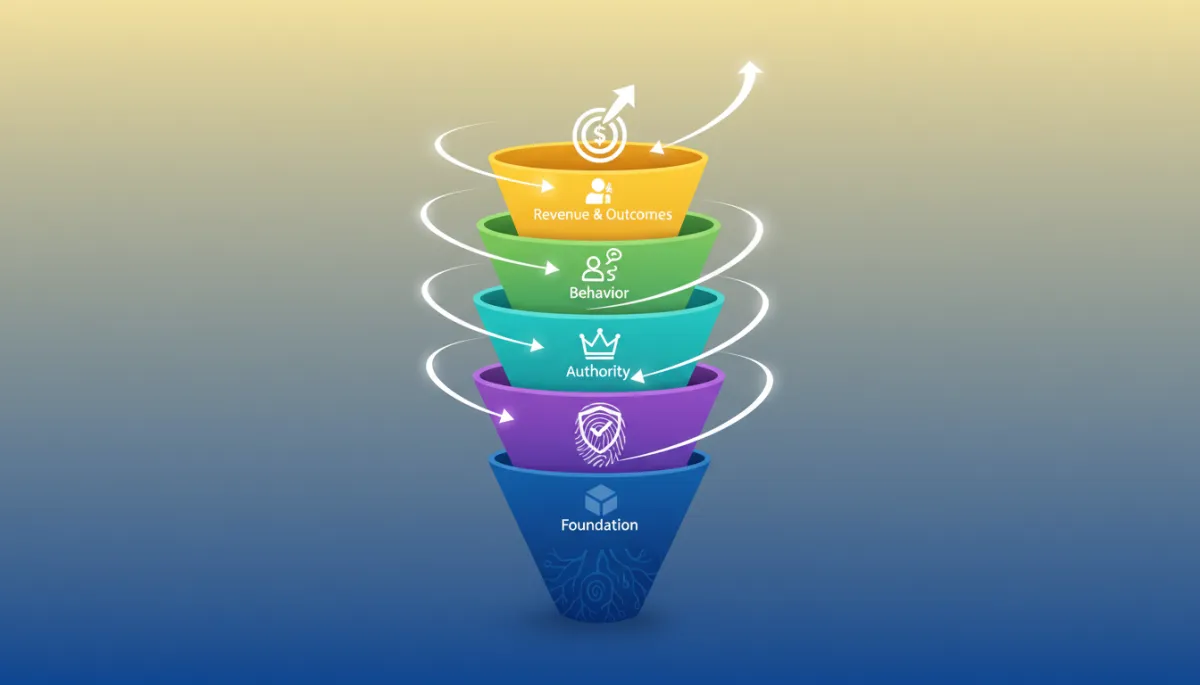
Think of your Local Maps Trust Stack™ as a complete operating framework for local growth, with layers that reinforce each other and directly connect to revenue:
Foundation: Accurate NAP, correct categories, complete GBP, proximity. This is your minimum viable presence—if it’s wrong or incomplete, everything above it underperforms.
Proof: Reviews, photos, posts, Q&A, attributes, service details. These elements answer, “Can I trust you?” in seconds for both Google and real customers.
Authority: Local backlinks, citations, editorial mentions, branded searches. This layer tells Google, “The wider community and web recognize this business as credible.”
Behavior: Calls, direction requests, clicks, on-site engagement. Positive user behavior confirms that Google’s choice to surface your listing was correct—and earns you more visibility.
Revenue & Outcomes: Leads, booked jobs, show rates, close rates, customer value, and review generation. This is where Maps performance is translated into pipeline, cash flow, and long-term growth.
The businesses at the top of Google Maps usually aren’t perfect—they simply have a stronger, more consistent stack across these layers than you do, and they track how each layer contributes to real revenue.
Local Maps Trust Stack™ Maturity Model
To turn this into an operating system, you can benchmark your business (or your clients) against a simple maturity model:
Level 1 – Listed: Basic GBP exists, but many fields are empty or inaccurate. Few reviews, inconsistent NAP, weak website support, little to no tracking of leads from Maps. You “exist,” but you’re not really competing.
Level 2 – Optimized: GBP is mostly complete and aligned with core services. Categories and NAP are correct, some location/service pages exist, and reviews are coming in sporadically. You show up for some searches but lack consistency and revenue predictability.
Level 3 – Trusted: Strong review profile, active posting, high-quality photos, and consistent NAP and citations. Users frequently choose your listing when it appears, and you track calls and form fills from Maps. Rankings and leads are steady but not yet dominant.
Level 4 – Authoritative: Robust local authority from backlinks, PR, and branded searches. Multiple locations or service pages rank well, engagement metrics are strong, and Maps is a reliable lead source. Revenue attribution from Maps is clear and regularly reported to leadership.
Level 5 – Dominant: You consistently appear in the top results across high-intent queries and neighborhoods. Your Local Maps Trust Stack™ is actively managed, and Maps is treated as a core revenue channel with targets, forecasts, and continuous optimization. Competitors are benchmarking against you.

📌 Key Takeaway: The goal isn’t just to “rank better”—it’s to intentionally move from Listed to Dominant by strengthening each layer of your Trust Stack in sequence.
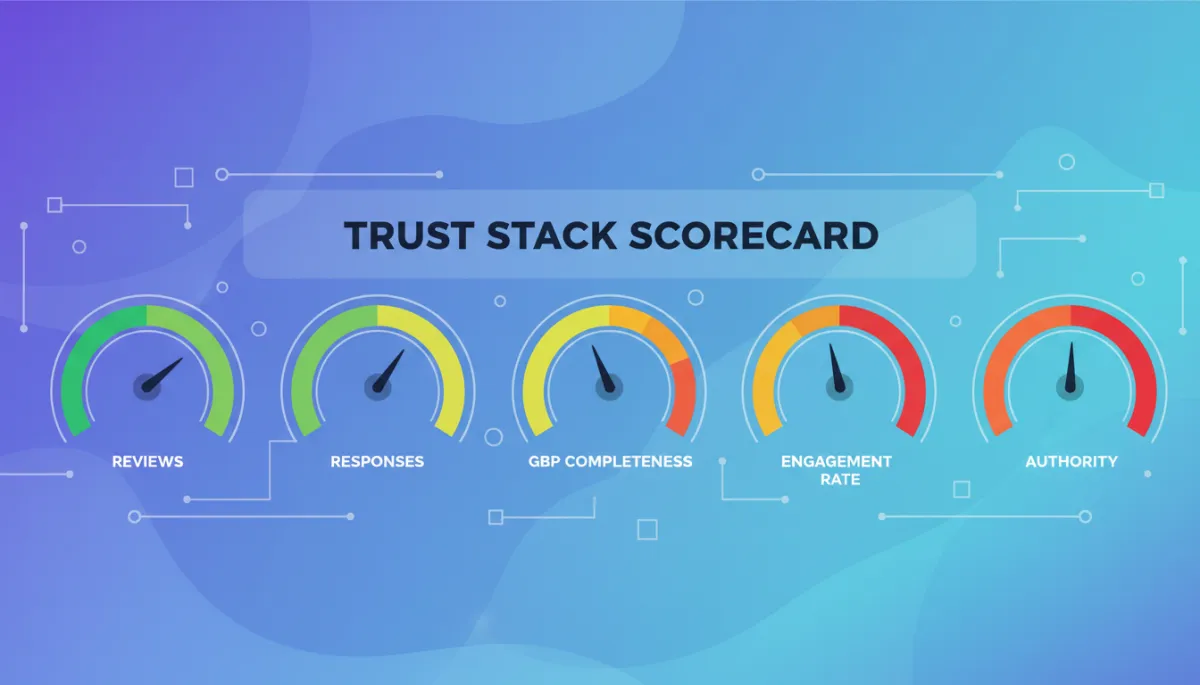
Local Maps Trust Stack™ Scorecard
To make this framework executive-friendly, you can summarize performance in a simple scorecard. Score each dimension from 1–5 and roll it up into an overall maturity band. Use benchmark bands so you can quickly see whether you’re lagging, on par, or leading your market:
DimensionWhat You MeasureTypical BenchmarksMaturity BandsGBP CompletenessFields filled, categories, services, photos, posts, attributes, links.<70% fields filled = lagging · 70–90% = competitive · >90% = leading1–2: Listed · 3: Optimized · 4: Trusted · 5: Authoritative/DominantReview Velocity & QualityTotal volume, average rating, review frequency, keyword relevance.<50 reviews & <4.2★ = lagging · 50–200 & 4.2–4.6★ = competitive · >200 & >4.6★ = leading1–2: Listed · 3: Optimized · 4: Trusted · 5: Authoritative/DominantReview Response Rate% of reviews with owner responses and average response time.<40% responses or >7 days = lagging · 40–80% or 2–7 days = competitive · >80% within 48 hours = leading1–2: Listed · 3: Optimized · 4: Trusted · 5: Authoritative/DominantCitation AccuracyNAP consistency across major directories and local listings.>25% inconsistent = lagging · 10–25% = competitive · <10% = leading1–2: Listed · 3: Optimized · 4: Trusted · 5: Authoritative/DominantLocal AuthorityQuality and relevance of local backlinks, PR, and “Best of” features.Few or low-quality local links = lagging · Some mid-tier local links = competitive · Regular PR, features, and high-authority local links = leading1–2: Listed · 3: Optimized · 4: Trusted · 5: Authoritative/DominantEngagement & ConversionImpressions-to-actions rate (calls, directions, website clicks), lead volume, close rate, revenue attribution.<3% actions per view = lagging · 3–7% = competitive · >7% = leading1–2: Listed · 3: Optimized · 4: Trusted · 5: Authoritative/Dominant
For leadership, this becomes a one-page Trust Stack Scorecard that shows where you are today, where you’re trying to go (your target maturity level), and which levers you’ll pull over the next quarter to close the gap. It also lets executives benchmark performance against industry norms rather than gut feel.
The Local Maps Revenue Path™
To tie everything together, map your Trust Stack directly to money using the Local Maps Revenue Path™. This is where you quantify how attention becomes revenue:
Visibility: Strong Foundation, Authority, and entity signals earn you more impressions in Maps and local search (e.g., 10,000 views per month).
Trust: Proof elements (reviews, photos, posts, Q&A) turn those impressions into confidence—“this business looks like the right choice.” This is reflected in your click-through and action rates.
Actions: Clear offers and accurate info drive calls, direction requests, website clicks, and messages from high-intent prospects (e.g., 5–10% of views become actions).
Leads: Those actions become leads in your CRM, inbox, or phone system. Lead-handling speed and quality determine how many convert from actions to qualified leads (often 40–70% if handled well).
Customers & Revenue: Closed deals create cash flow, repeat business, and lifetime value that justify continued investment in Maps. Here you track close rate, average order value, and customer lifetime value.
Reviews & Advocacy: Delighted customers leave reviews and refer friends, which feeds back into your Proof and Behavior layers—strengthening future rankings and starting the cycle again at a higher level.
Local Maps Revenue Economics™
The Local Maps Revenue Economics™ model puts hard numbers to this path so executives can see exactly how Maps performance drives pipeline and profit. At a simple level, you can express it as:
Monthly Revenue from Maps = Searches × View Rate × Action Rate × Lead Rate × Close Rate × Avg. Order Value
Where, for a given month:
Searches: Estimated local searches for your core terms (from Google Ads Keyword Planner, Search Console, and GBP Insights).
View Rate: Percentage of those searches where you appear in the Map Pack or Maps results (driven by your Trust Stack Foundation and Authority).
Action Rate: Percentage of views that turn into actions (calls, directions, website clicks)—a direct reflection of your Proof and engagement quality.
Lead Rate: Percentage of actions that become qualified leads (influenced by your lead capture flows and front-desk processes).
Close Rate: Percentage of leads that become paying customers (a sales and operations metric).
Average Order Value / Lifetime Value: Revenue per new customer, including repeat purchases and referrals where possible.
When you plug in even conservative numbers, executives quickly see how small improvements in any stage—more views, better action rates, stronger close rates—compound into meaningful revenue gains. This is what turns “local SEO” from a cost center into a forecastable growth channel.
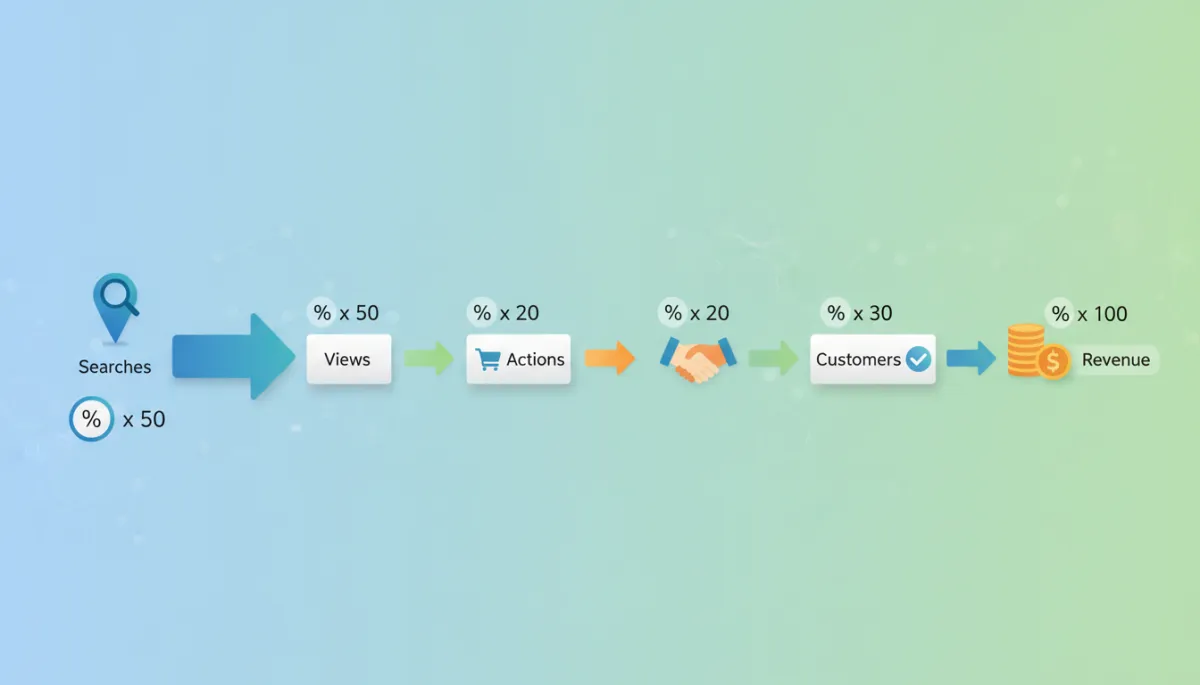
💡 Pro Tip: When reporting to executives, don’t stop at “views and calls.” Walk them through the full Local Maps Revenue Path™ and Local Maps Revenue Economics™—from impressions to revenue and back to reviews—so Maps is seen as a growth engine, not a vanity metric.
Revenue Leakage Framework™
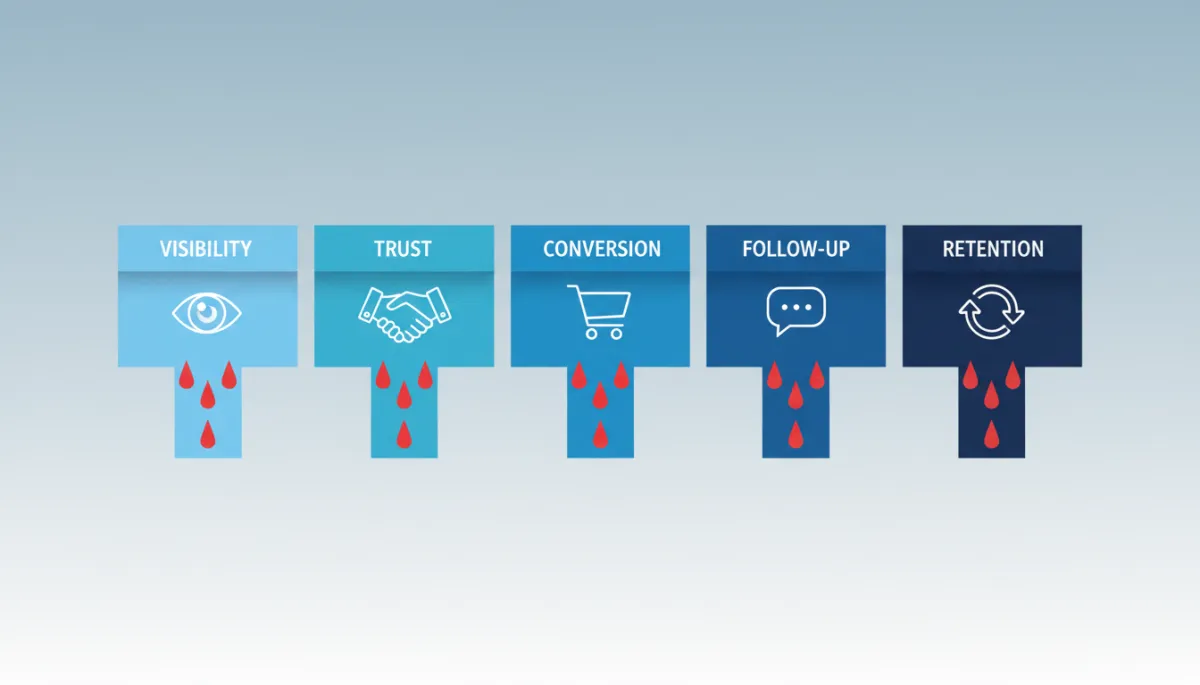
Once you quantify your funnel, the next step is to identify where money leaks out. The Revenue Leakage Framework™ maps five stages—Visibility, Trust, Conversion, Follow-Up, and Retention—and asks, “Where are we losing momentum?”
Visibility Leakage: Low share of impressions for high-intent searches. Symptoms: low view counts, weak rankings, low brand search volume. Root causes: poor Foundation and Authority layers (categories, NAP, citations, backlinks).
Trust Leakage: Plenty of views but poor action rates. Symptoms: users see you but don’t click or call. Root causes: weak reviews, outdated photos, thin profile content, unclear positioning.
Conversion Leakage: High actions but low lead creation. Symptoms: calls dropped, forms abandoned, chat messages unanswered. Root causes: complex forms, slow site, confusing CTAs, no call tracking or routing.
Follow-Up Leakage: Many leads but poor close rates. Symptoms: quotes sent but not closed, no follow-up cadence, missed callbacks. Root causes: no CRM workflows, no scripts, no accountability for speed-to-lead or follow-up attempts.
Retention & Advocacy Leakage: New customers don’t return or leave reviews. Symptoms: low repeat purchase rate, weak review growth, few referrals. Root causes: no post-job nurture, no review-request system, no loyalty or referral programs.
For executives, this framework becomes a diagnostic checklist. Instead of asking “Why isn’t Maps working?”, they ask “Where are we leaking revenue along the Local Maps Revenue Path™, and which layer of the Trust Stack needs attention first?”
Why Better Businesses Often Rank Lower
Many owners feel the sting of seeing a clearly inferior competitor outrank them. The reason is rarely that Google “likes bad businesses.” It’s that Google can only reward what it can see and measure. Operational weaknesses in your marketing and customer experience often suppress rankings, even when your actual service is outstanding. Common examples include:
No review system: You do great work but don’t ask for reviews consistently, so your Proof layer is thin compared to louder competitors.
Poor lead handling: Calls go unanswered, forms sit in inboxes, and response times are slow. Behavior signals suffer because users bounce to competitors who pick up the phone.
Inconsistent data: Old addresses, mismatched phone numbers, and outdated hours across directories confuse both users and algorithms, weakening your Foundation and Authority layers.
Weak offers and messaging: Even if your service is exceptional, vague or generic profile copy fails to convert visibility into actions, so engagement and conversion metrics lag behind competitors with clearer positioning.
In other words, operational gaps—not service quality—often keep “better” businesses buried. The Local Maps Trust Stack™ forces you to fix those gaps so your real-world excellence is reflected in your digital footprint and rankings.
How AI Is Rewriting Local Maps Visibility
Under the hood, Google Maps is increasingly powered by AI systems that interpret entities, intent, and behavior—not just keywords. Three trends matter most for your Trust Stack:
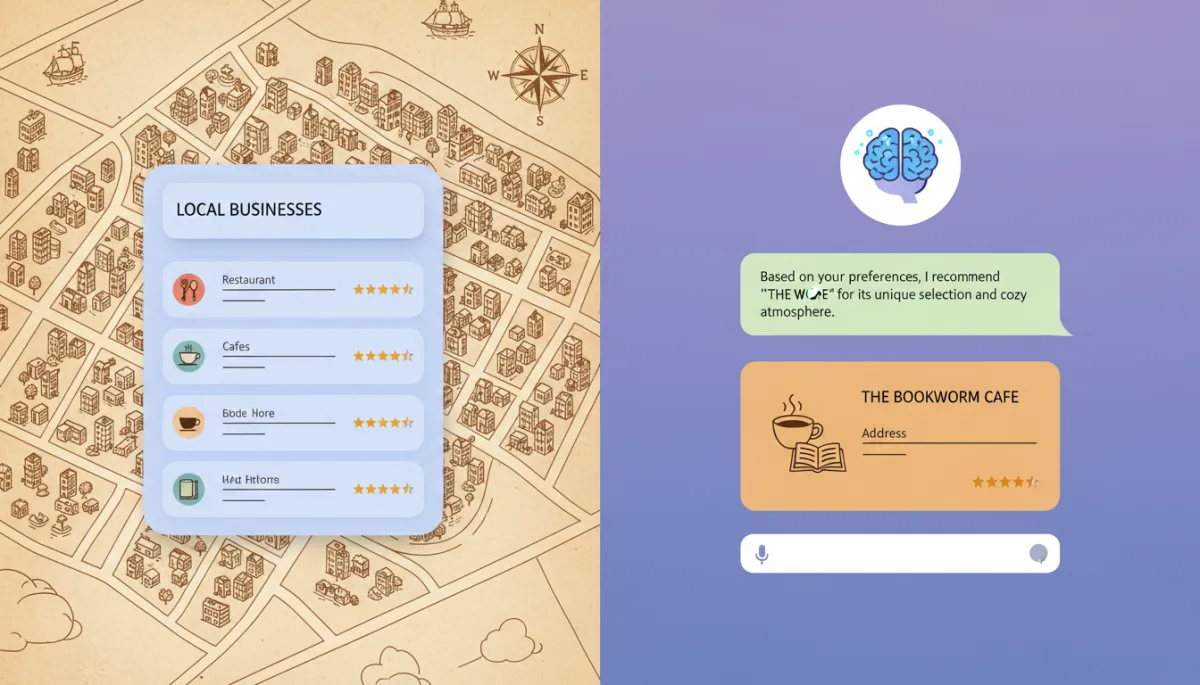
AI Recommendation Engines: Google’s models learn which types of businesses users tend to choose and be satisfied with for specific intents (“urgent,” “family-friendly,” “budget,” “luxury”). If your engagement and review patterns match those successful outcomes, you’re more likely to be recommended in future similar searches. In practical terms, these systems are becoming the next generation of local directories—deciding which three businesses get surfaced first, not just listing everyone in the area.
AI Search Assistants: As more users rely on conversational assistants (like “Where’s the best pediatric dentist near me that’s open now and great with anxious kids?”), Google leans on richer entity data: services, attributes, review language, and Q&A content. Businesses that clearly structure and label this information in their GBP and website feed these assistants better signals—and are more likely to be the single recommended option, not just one result in a long list.
Entity-Based Ranking Systems: Google doesn’t just see “keywords”; it sees entities—businesses, people, places, services—and the relationships between them. Local backlinks, citations, brand searches, and even co-mentions in local media help Google understand that your business is a strong entity for a given category and geography. Over time, this entity strength determines how often AI systems “trust” you enough to recommend you first.
Practically, this means your Local Maps Trust Stack™ isn’t just for a static “search results page.” It’s the data foundation AI systems use to decide which business to recommend in real time—across Maps, Search, and assistant experiences. As AI-driven interfaces replace traditional directory browsing, businesses with richer Trust Stacks will increasingly capture a disproportionate share of local demand.
Conducting Competitor Gap Analysis on Google Maps
For agencies, a structured competitor gap analysis turns guesswork into a clear roadmap. For each top-ranking competitor:
Audit their GBP: categories, services, photos, posts, attributes, Q&A, and name keywords.
Compare review count, rating, recency, and response strategy to your own.
Review their website: local pages, schema, content depth, and calls to action.
Check citations and backlinks using SEO tools to see where their authority comes from.
The gaps you uncover—missing categories, weak reviews, poor content, or thin authority—become your prioritized action list for the next 90 days.
The Maps Gap Analysis Framework™
To make competitor research repeatable and client-ready, formalize it into a Maps Gap Analysis Framework™. Instead of ad hoc notes, you systematically compare your Trust Stack to the top 3–5 ranking competitors across five dimensions:
Categories & Foundation: How tightly are their primary and secondary categories aligned to high-intent searches? Is their NAP spotless across key directories? Do they have more complete GBP fields than you?
Reviews & Proof: How many reviews do they have? What’s their average rating and review velocity? Do their reviews contain richer, more specific keywords and stories than yours? Are they responding more consistently?
Authority & Citations: Which local sites, news outlets, blogs, and “Best of” lists link to or mention them? How does their citation footprint compare to yours in terms of quality, quantity, and accuracy?
Engagement & Experience: Do their photos, posts, and offers look more compelling? Are they using attributes, booking links, or messaging features more effectively to drive actions?
Conversion & Revenue Outcomes: Based on what you can see (offers, pricing clarity, calls-to-action) and what you know internally (close rates, revenue per lead), are they likely converting a higher percentage of their Maps traffic into revenue?
For each dimension, score your business and each competitor from 1–5, then highlight the largest gaps. Those become your quarterly priorities. For example:
If your biggest gap is in Reviews & Proof, your next 90 days should focus on review systems, follow-up, and response quality.
If your biggest gap is in Authority & Citations, your priority becomes local PR, sponsorships, and citation cleanup.
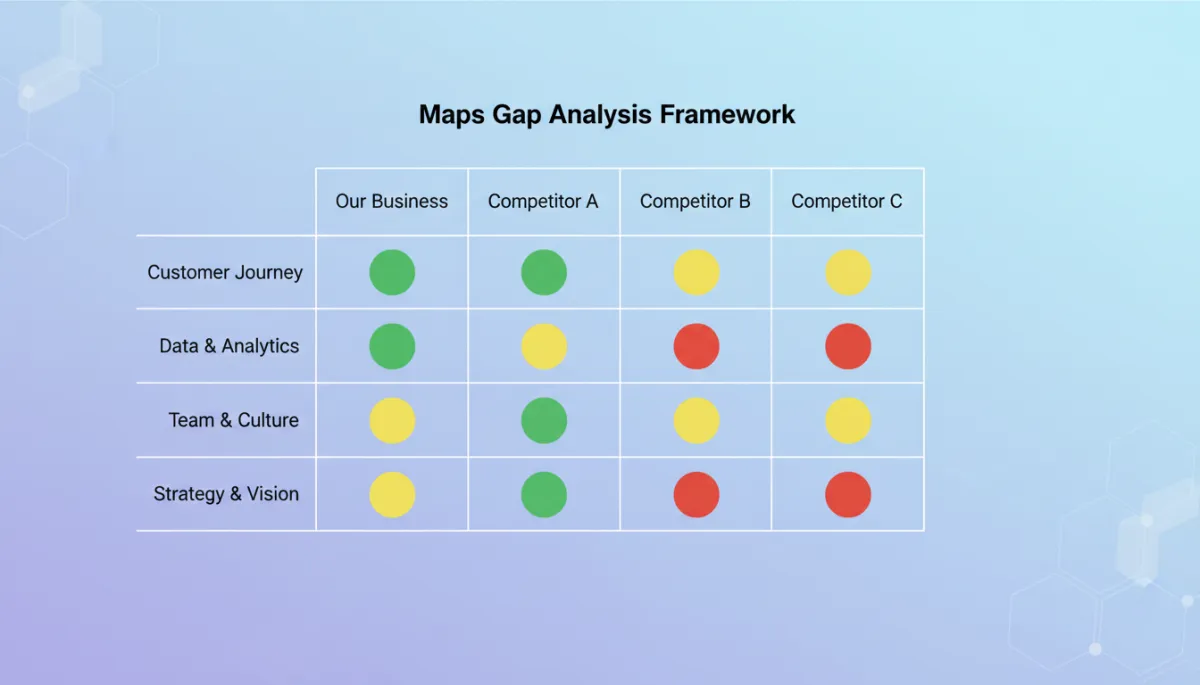
📌 Key Takeaway: The Maps Gap Analysis Framework™ turns “we should do better on Google Maps” into a concrete, ranked backlog of actions that move you up the Local Maps Trust Stack™ and closer to Dominant status.
Why Ranking Higher Doesn’t Always Mean More Revenue
Visibility is not the finish line; it’s the starting point. Many businesses chase rankings and then wonder why revenue doesn’t move. Common reasons include:
Weak offers or unclear messaging on the profile and website.
Slow or unprofessional responses to calls, forms, and messages.
Targeting low-intent keywords that drive views but not buyers.
For agencies, the real win is not “top 3 in the Map Pack,” but more booked jobs, appointments, and sales. That means pairing ranking work with conversion optimization and lead-handling processes.
A 30–60–90 Day Action Plan for Local SEO & Revenue Growth
Days 1–30: Fix the Foundations
Audit and fully optimize your Google Business Profile (categories, services, photos, attributes, hours, posts).
Standardize NAP across your website and top citation sites.
Launch or refine at least one strong location or service page that mirrors your primary category and core keywords.
Days 31–60: Build Proof and Authority
Implement a review-generation system: email/SMS follow-ups, QR codes, and staff scripts to request feedback ethically and consistently.
Respond to every review and populate Q&A with helpful, keyword-aware answers.
Secure key local citations and begin outreach for local backlinks—sponsorships, partnerships, guest features, and “Best of” lists.
Days 61–90: Optimize Engagement and Conversion
Analyze Insights and analytics: which searches, photos, and posts drive the most actions? Double down on what works.
Improve calls-to-action on your profile and site: clear offers, simple contact options, and fast-loading mobile pages.
Train front-line staff to handle calls and leads quickly and professionally so that new visibility actually turns into revenue.
Turning Maps Rankings into Measurable Business Growth
When you view Google Maps as a trust marketplace rather than a beauty contest, the path forward becomes clear. Competitors outrank you because they’ve systematically built stronger trust signals across their Business Profile, website, reviews, citations, authority, and engagement.
For businesses and agencies, the opportunity is twofold: strengthen your Local Maps Trust Stack™ and design a 30–60–90 day plan that doesn’t just chase rankings, but converts every new view into real revenue. Layer in the Local Maps Revenue Economics™, Revenue Leakage Framework™, and AI-driven discovery trends, and this becomes a complete Google Maps growth methodology—not just another Local SEO checklist. Do that consistently, and “Why are they above us?” turns into “How did we become the obvious choice in our market?”


